1
Please refer to important disclosures at the end of this report
1
1
Particulars (` cr)
Q2FY20
Q1FY20
% chg (qoq)
Q2FY19
% chg (yoy)
NII
869
817
6
593
46
Pre-prov. profit
636
619
3
449
42
PAT
54
267
(80)
205
(73)
For Q2FY2020, RBL Bank (RBL) reported PAT of `54cr, down 80%/73% qoq/yoy
primarily owing to elevated provision on new identified stressed asset (`1,800cr).
However, on all other fronts, the bank reported healthy numbers viz. pre-prov
profit jumped 42% yoy, NIM up 42bps/12bps yopy/qoq to highest level at 4.35%
and CASA ratio up 200bps yoy to 27%.
Asset quality declines: RBL has reported an increase in the identified pool of
stressed assets to the extent of `1,800cr, which was higher vs. guided figure of
`1,000cr at the end of Q1FY2020. This led to the addition of `1,377cr to GNPAs
during the quarter, which now stands at `1,539cr vs. `789cr in Q1FY2020.
Gross NPAs as a % of loan book increased to 2.60% from 1.38% in Q1FY20. Net
NPA was up from `372cr (0.65%) to `915cr (1.56%).
In the conference call, the management guided for elevated provisioning in
Q3FY2020, which will normalize by Q4FY2020 as the bulk of the provisioning
towards the stressed assets will be done by Q3. We believe that the bank has
accounted for all stressed portfolios, which is evident from the minuscule number
in SMA1 (0.45%) and SMA2 (0.39%). Bank has also provided details on exposure
to real estate, construction, NBFC, and Power sectors, which are all standard and
gives us further confidence in the remaining wholesale book.
We believe that RBL is earning enough PPOP for taking PCR to 50% on the
stressed book by the Q3 and we expect provisioning to normalize by Q4FY2020.
Robust growth in advances; NIMs improve: During Q2FY2020, the bank’s
advances grew by 27% yoy, out of which retail loan book increased 62% yoy to
constitute 34% of the total advances. The wholesale loans inched up 12% yoy.
During the quarter, NIM increased by 27bps yoy to 4.35%, aided by higher yield
on advances (up 120bps yoy) as against cost of funds (up 40bps yoy); NIMs have
continued to expand since last 10 quarters. However, going forward interest
reversal on slippages would keep NIMs under pressure.
Outlook & Valuation: RBL Bank’s fresh set of stressed pool would push back ROA
of 1.5% to Q2FY2021. We expect RBL Bank to grow its advances at CAGR of 27%
over FY2019-21E. Improvement in CASA, higher share of retail book and in-
house priority sector lending will support NIM going forward. At CMP, RBL trades
at 1.4x FY21E P/ABV. We maintain our Buy rating with Target Price of `410.
Key financials (Standalone)
Y/E March (` cr)
FY17
FY18
FY19
FY20E
FY21E
NII
1,221
1,766
2,539
3,240
4,109
% chg
42
27
33
32
32
Net profit
446
635
867
674
1,550
% chg
52.5
42.3
36.6
(22.3)
130.1
NIM (%)
2.9
3.4
3.7
3.7
3.7
EPS (`)
10.4
14.8
20.3
15.8
36.2
P/E (x)
28
19
14
18
8
P/ABV (x)
2.9
1.9
1.7
1.6
1.4
RoA (%)
1.0
1.1
1.2
0.7
1.32
RoE (%)
12.2
11.5
12.2
8.6
17.7
Source: Company, Angel Research, Valuation done on closing price of 30/10/19
BUY
CMP `289
Target Price `410
Investment Period 12 Months
Stock Info
Sector
Bloomberg Code
Shareholding Pattern (%)
Promoters 0.0
MF / Banks / Indian Fls 25.8
FII / NRIs / OCBs 18.6
Indian Public / Others 55.7
Abs. (%) 3m 1yr 3yr
Sensex 7.1 18.2 43.7
RBL Bank (27.5) (45.0) (27.0)
Nifty
11,844
Reuters Code
RATB BO
RBK IN
Face Value (`)
10
BSE Sensex
40,052
52 Week High / Low
716 / 231
Avg. Daily Volume
16,23,000
Beta
1.8
Banking
Market Cap (` cr)
12,429
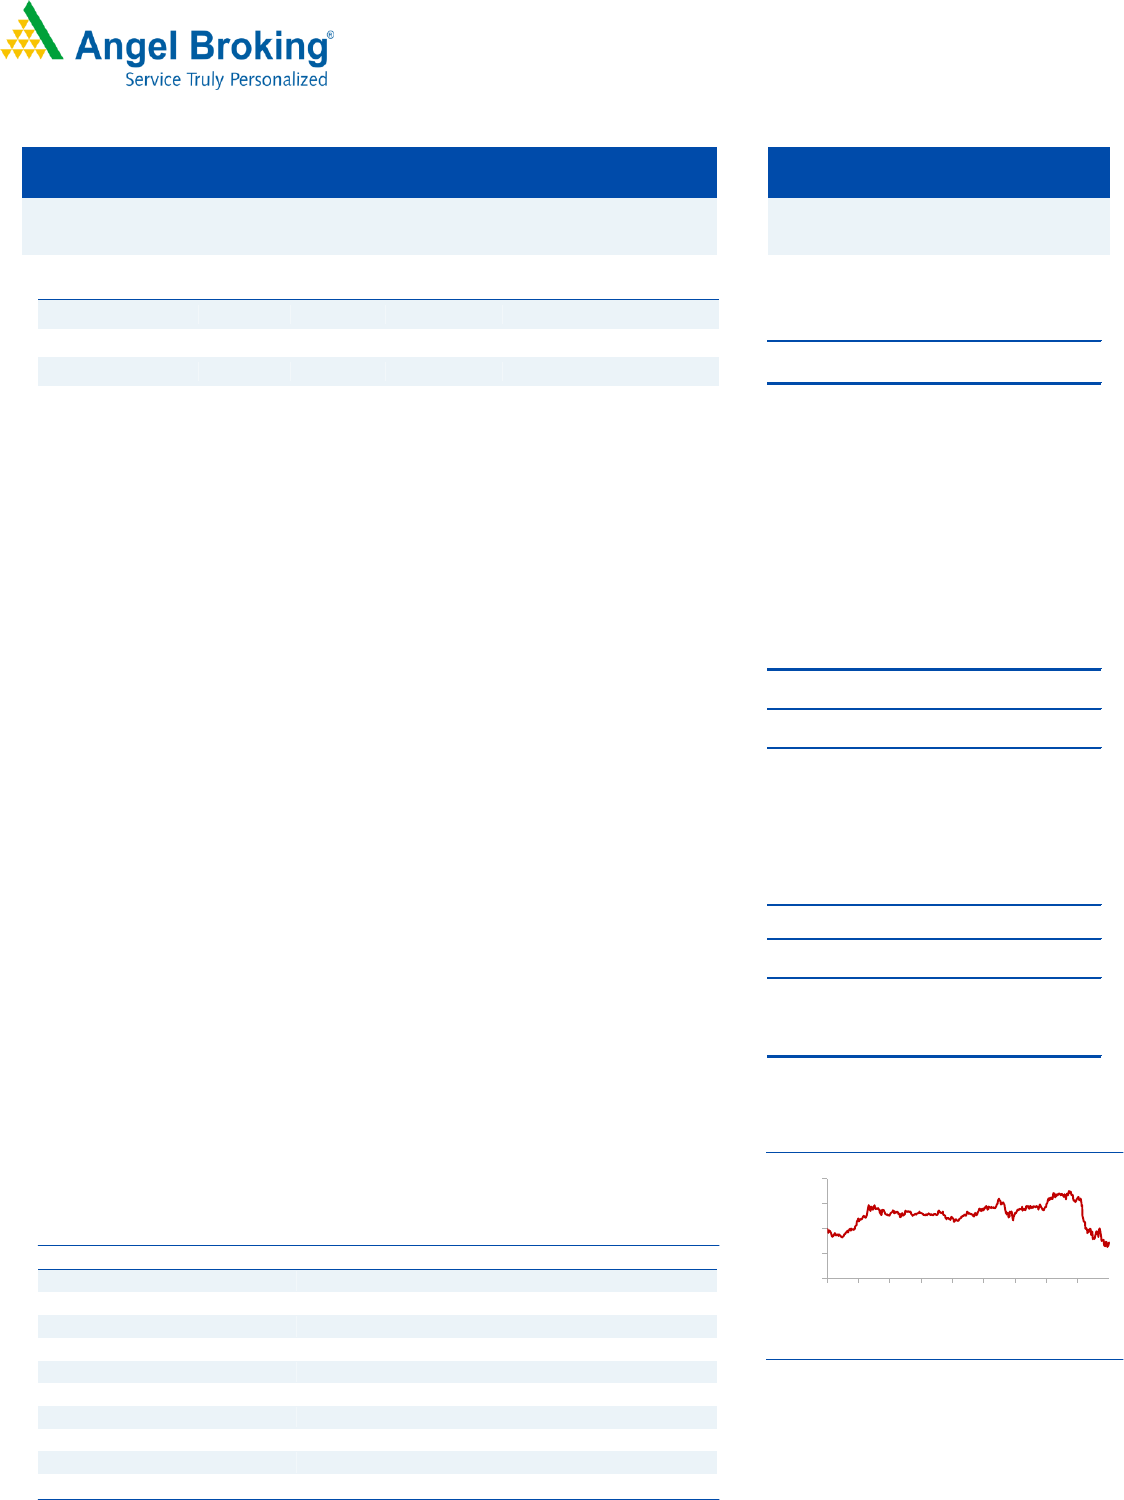
3-year price chart
0
200
400
600
800
Nov-16
Mar-17
Jul-17
Nov-17
Mar-18
Jul-18
Nov-18
Mar-19
Jul-19
RBL Bank
Healthy operating performance; higher NPA recognition and
provision mar profitability
Q2FY2020 Result Update | Banking
Oct 31, 2019

2
Q2FY2020 Result Update | India Research
Oct 31, 2019
2
Increase in identified stressed asset: During the quarter, bank has added `800cr to
already disclosed stress asset (`1,000cr) in Q1FY2020, which was the sentiment
spoiler for investor. In Q2FY2020 gross slippages were much higher at `1,377cr
vs. normal run rate of `200cr. Of which, `250cr was technical slippages and
`800cr from identified stressed asset; for this, the bank has taken provision worth
`350cr, which is excess of regulatory requirement. Management guided that bank
would take aggressive provision in Q3FY2020 also on identified stressed asset to
shore up PCR and consequently Q4FY2020 onwards bank’s slippage will
normalize in the range of `250-300cr.
We believe that RBL is earning enough PPOP for taking PCR to 50% on the stressed
book by Q3 and we expect provisioning to normalize by Q4FY20.
Impressive deposit & fee income growth: Bank continues to report impressive
deposit growth of ~31%/3% on yoy/qoq basis. CASA deposits also witnessed
healthy growth of 42%/6% on yoy/qoq basis. Increasing branch network and
higher interest rates have helped the bank. Total fee income grew ~33% on yoy
basis. Card fees grew ~70%/24% on yoy/qoq basis, which now constitutes ~57%
of fee income and grew 1000bps qoq. Increase in the number of cards and POS
terminals have supported jump in card fee growth.
RBL Is developing very strong retail business which has higher yield and ROE
Over the last few years, RBL Bank has developed a very strong retail franchisee in
credit card and development banking (mainly micro banking). In the credit card
business, RBL has increased its market share from 2.13% at the end of March
2018 to 4.26% in August 2019. The company is adding about 1 lakh new cards
per month since December 2018, which is in-line with some of the larger banks
like HDFC Bank. We believe that the company’s strategy of focusing on high
margin retail business will help increase NIMs and profitability for the bank going
forward.
At current levels, RBL is trading at P/B multiple of 1.4x FY2021 ABV, which we
believe is very inexpensive given the bank’s strong retail franchise. Retail is a high
margin high RoE business and listed players with strong retail franchises are
trading at significantly higher valuations. We believe that valuations have become
very cheap for RBL at current levels, which should prevent any further significant
downsides in the stock. We agree with the management’s view that the asset
quality issues are transient and will normalize by Q4FY2020 given the
management’s decision to make aggressive provisioning in Q2 and Q3.
3
Q2FY2020 Result Update | India Research
Oct 31, 2019
3
Exhibit 1: Quarterly Performance
Particulars (` cr)
Q4FY18
Q1FY19
Q2FY19
Q3FY19
Q4FY19
Q1FY20
Q2FY20
% chg (yoy)
% chg (qoq)
Interest Earned
1,223
1,364
1,463
1,639
1,834
2,023
2,126
45
5
on Advances / Bills
953
1,077
1,173
1,330
1,469
1,619
1,720
47
6
on investments
250
261
261
274
297
340
339
30
(0)
on bal with RBI & others
17
19
23
24
45
42
56
144
33
on others
4
7
6
10
23
22
11
90
(50)
Interest Expended
722
812
870
984
1,095
1,205
1,257
44
4
Net Interest Income
500
553
593
655
739
817
869
46
6
Other Income
312
326
333
374
409
481
442
33
(8)
Operating income
812
879
926
1,029
1,148
1,299
1,310
41
1
Operating Expenses
429
446
477
531
588
680
674
41
(1)
Employee expenses
131
153
151
164
168
185
196
30
6
Other Opex
299
293
326
367
420
495
478
47
(3)
Pre Provision Profit
383
432
449
498
560
619
636
42
3
Provisions & Contingencies
113
140
140
161
200
213
533
282
150
PBT
270
292
309
338
360
406
103
(67)
(75)
Provision for Taxes
92
102
105
113
113
139
48
(54)
(65)
Tax rate
34
35
34
33
31
34
47
39
38
PAT
178
190
205
225
247
267
54
(73)
(80)
Balance sheet
Advance (` cr)
40,268
42,198
45,873
49,893
54,308
56,837
58,472
27
3
Deposit (` cr)
43,902
44,950
47,790
52,187
58,394
60,811
62,829
31
3
Credit-to-Deposit Ratio (%)
92
94
96
96
93
93
93
(292.3)bp
(40)bp
CA (` cr)
5,356
5,214
5,687
6,315
6,365
5,655
6,534
15
16
SA (` cr)
5,356
5,799
6,022
6,523
8,234
10,034
10,115
68
1
CASA deposits (` cr)
10,712
11,013
11,709
12,838
14,599
15,689
16,650
42
6
CASA %
24.40
24.50
24.50
24.60
25.00
25.80
27
199.9bp
70bp
CAR (%)
15
15
14
14
13
12
12
(140)bp
(10)bp
Tier 1 CAR (%)
14
13
13
13
12
11
11
(120)bp
0bp
Profitability Ratios (%)
Yield on Adv Reported
10.5
10.8
10.9
11.2
11.8
12.0
12.1
120bp
10bp
Cost of funds Reported
6.2
6.4
6.4
6.6
6.8
6.8
6.8
40bp
0bp
NIM Reported
4.0
4.0
4.1
4.1
4.23
4.23
4.35
27bp
12bp
Cost-to-income ratio
0.53
0.51
0.52
0.52
0.51
0.52
0.5
(0)bp
(0.9)bp
Asset quality
Gross NPAs (` cr)
567
596
645
696
755
789
1,539.0
139
95
Gross NPAs (%)
1.40
1.40
1.42
1.38
1.38
1.38
2.6
118bp
122bp
Net NPAs (` cr)
313
316
339
358
373
372
912.0
169
145
Net NPAs (%)
0.8
0.7
0.7
0.7
0.69
0.65
1.6
82bp
91bp
PCR (%)
43
50
48
48
50
53
40
(788.7)bp
(1289.9)bp
PCR Reported (%)
58
60
62
63
65
69
58.4
(310)bp
(1070)bp
Slippage ratio (%)
1.1
1.4
1.2
1.7
1.5
1.6
9.4
818.2bp
783.6bp
Credit Cost on Adv (Annl)
1.1
1.3
1.2
1.3
1.5
1.5
3.6
243bp
214.8bp
Source: Company, Angel Broking Research

4
Q2FY2020 Result Update | India Research
Oct 31, 2019
4
Income Statement
Particular (`)
FY17
FY18
FY19
FY20E
FY21E
Net Interest Income
1,221
1,766
2,539
3,240
4,109
- YoY Growth (%)
49
45
44
28
27
Other Income
755
1,068
1,442
1,925
2,459
- YoY Growth (%)
54
41
35
33
28
Operating Income
1,977
2,834
3,982
5,164
6,568
- YoY Growth (%)
51
43
40
30
27
Operating Expenses
1,056
1,504
2,042
2,635
3,393
- YoY Growth (%)
38
42
36
29
29
Pre - Provision Profit
920
1,331
1,940
2,530
3,175
- YoY Growth (%)
70
45
46
30
26
Prov. & Cont.
239
365
641
1,629
1,103
- YoY Growth (%)
109
53
76
154
(32)
Profit Before Tax
681
966
1,299
900
2,072
- YoY Growth (%)
59
42
34
(31)
130
Prov. for Taxation
235
331
432
227
521
- as a % of PBT
35
34
33
25
25
PAT
446
635
867
674
1,550
- YoY Growth (%)
53
42
37
(22)
130
Balance sheet
Y/E March (` cr)
FY17
FY18
FY19
FY20E
FY21E
Equity
375
420
427
427
427
Reserve & Surplus
3,960
6,264
7,121
7,693
9,011
Net worth
4,336
6,684
7,547
8,120
9,438
Deposits
34,588
43,902
58,394
77,227
1,02,160
- Growth (%)
42
27
33
32
32
Borrowings
7,980
9,261
11,832
14,198
18,032
Other Liab. & Prov.
1,785
2,003
2,585
2,569
3,356
Total Liabilities
48,689
61,851
80,359
1,02,115
1,32,986
Cash Balances
2,948
2,589
8,440
4,747
6,279
Bank Balances
1,246
1,695
1,763
2,712
3,588
Investments
13,482
15,448
16,840
23,734
31,393
Advances
29,449
40,268
54,308
67,885
88,251
- Growth (%)
39
37
35
25
30
Fixed Assets
259
334
402
610
807
Other Assets
1,306
1,517
2,206
2,426
2,669
Total Assets
48,689
61,851
83,959
1,02,115
1,32,986
- Growth (%)
24
27
36
22
30
5
Q2FY2020 Result Update | India Research
Oct 31, 2019
5
Ratio analysis
Y/E March (` Cr)
FY17
FY18
FY19
FY20E
FY21E
Profitability ratios (%)
NIMs
2.9
3.4
3.7
3.7
3.7
Cost to Income Ratio
53.4
53.0
51.3
51.0
51.7
RoA
1.0
1.1
1.2
0.74
1.32
RoE
12.2
11.5
12.2
8.6
17.7
B/S ratios (%)
CASA Ratio
0.22
0.24
0.25
0.26
0.26
Credit/Deposit Ratio
0.9
0.9
0.9
0.9
0.9
Asset Quality (%)
Gross NPAs
1.21
1.41
1.33
2.60
2.20
Gross NPAs (` cr)
356.8
566.7
722.3
1,765
1,941.5
Net NPAs
0.64
0.78
0.73
1.10
1.10
Net NPAs (` cr)
189.9
314.0
396.5
746.7
970.8
Credit Cost on Advance
0.81
0.91
1.18
2.40
1.25
Provision Coverage
53%
55%
55%
42%
50%
Per Share Data (`)
EPS
10.4
14.8
20.3
15.8
36.2
BV
101.4
156.3
176.5
189.8
220.7
ABVPS (70% cover)
99.4
152.9
172.3
184.8
211.6
DPS
1.8
2.3
3.0
2.4
5.4
Valuation Ratios
PER (x)
27.7
19.4
14.2
18.3
8.0
P/BV
2.8
1.8
1.6
1.5
1.3
P/ABVPS (x)
2.9
1.9
1.7
1.6
1.4
Dividend Yield
0.6
0.8
1.1
0.8
1.9
Note – Valuation done on closing price of 30/10/2019

6
Q2FY2020 Result Update | India Research
Oct 31, 2019
6
Disclosure of Interest Statement RBL Bank
1. Financial interest of research analyst or Angel or his Associate or his relative No
2. Ownership of 1% or more of the stock by research analyst or Angel or associates or relatives No
3. Served as an officer, director or employee of the company covered under Research No
4. Broking relationship with company covered under Research No
Research Team Tel: 022 - 39357800 E-mail: [email protected] Website: www.angelbroking.com
Angel Broking Limited (hereinafter referred to as “Angel”) is a registered Member of National Stock Exchange of India Limited, Bombay
Stock Exchange Limited, Metropolitan Stock Exchange Limited, Multi Commodity Exchange of India Ltd and National Commodity &
Derivatives Exchange Ltd It is also registered as a Depository Participant with CDSL and Portfolio Manager and Investment Adviser with
SEBI. It also has registration with AMFI as a Mutual Fund Distributor. Angel Broking Limited is a registered entity with SEBI for Research
Analyst in terms of SEBI (Research Analyst) Regulations, 2014 vide registration number INH000000164. Angel or its associates has not
been debarred/ suspended by SEBI or any other regulatory authority for accessing /dealing in securities Market. Angel or its
associates/analyst has not received any compensation / managed or co-managed public offering of securities of the company covered
by Analyst during the past twelve months.
This document is solely for the personal information of the recipient, and must not be singularly used as the basis of any investment
decision. Nothing in this document should be construed as investment or financial advice. Each recipient of this document should
make such investigations as they deem necessary to arrive at an independent evaluation of an investment in the securities of the
companies referred to in this document (including the merits and risks involved), and should consult their own advisors to determine
the merits and risks of such an investment.
Reports based on technical and derivative analysis center on studying charts of a stock's price movement, outstanding positions and
trading volume, as opposed to focusing on a company's fundamentals and, as such, may not match with a report on a company's
fundamentals. Investors are advised to refer the Fundamental and Technical Research Reports available on our website to evaluate the
contrary view, if any
The information in this document has been printed on the basis of publicly available information, internal data and other reliable
sources believed to be true, but we do not represent that it is accurate or complete and it should not be relied on as such, as this
document is for general guidance only. Angel Broking Limited or any of its affiliates/ group companies shall not be in any way
responsible for any loss or damage that may arise to any person from any inadvertent error in the information contained in this report.
Angel Broking Limited has not independently verified all the information contained within this document. Accordingly, we cannot testify,
nor make any representation or warranty, express or implied, to the accuracy, contents or data contained within this document. While
Angel Broking Limited endeavors to update on a reasonable basis the information discussed in this material, there may be regulatory,
compliance, or other reasons that prevent us from doing so.
This document is being supplied to you solely for your information, and its contents, information or data may not be reproduced,
redistributed or passed on, directly or indirectly.
Neither Angel Broking Limited, nor its directors, employees or affiliates shall be liable for any loss or damage that may arise from or in
connection with the use of this information.